In the world of technical analysis, a Bullish Candle (often referred to as a Green Candle or Positive Candle) is the most fundamental building block of an uptrend. Whether you are trading stocks, forex, or crypto, understanding how to read bullish price action is essential for identifying buying opportunities.369
In this guide, we will break down the definition, key characteristics, types of bullish candles, and exactly how to trade them.
What is a Bullish Candle?
A Bullish Candle represents a period where the closing price is higher than the opening price. It signals that the “bulls” (buyers) were in control of the market during that specific timeframe, successfully pushing prices upward despite any selling pressure.
The Anatomy of a Bullish Candle
To read a bullish candle correctly, you must look at its four price points:
-
Open: The price at the start of the timeframe.
-
Close: The price at the end of the timeframe (higher than the open).
-
High: The highest price reached during the period (the top of the upper wick).
-
Low: The lowest price reached during the period (the bottom of the lower wick).
Key Characteristics of Bullish Price Action
Color: Usually displayed as Green or White on most trading platforms like TradingView.
Body Size: A large real body indicates strong buying conviction, while a small body suggests indecision.
Wicks (Shadows): Long lower wicks suggest that buyers “bought the dip,” rejecting lower prices. Short or no upper wicks suggest the bulls finished the session at maximum strength.
Common Types of Bullish Candles
Not all bullish candles are created equal. Here are the most significant ones to watch:
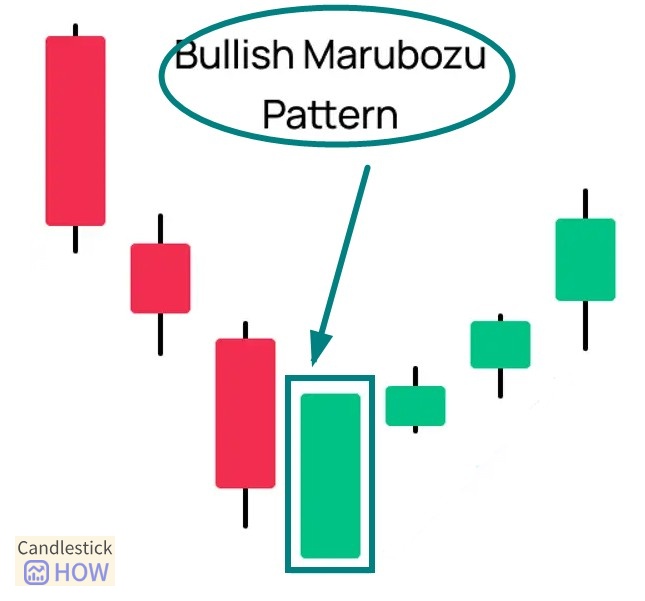
1. Bullish Marubozu (The Powerhouse)
A long body with little to no wicks. This shows that buyers controlled the price from the opening bell to the closing bell.
2. Hammer (The Reversal)
A small body at the top with a long lower wick. It usually appears at the bottom of a downtrend, signaling that a reversal is coming.
3. Bullish Engulfing (The Trend Shifter)
A two-candle pattern where a large bullish candle completely “swallows” the previous small bearish candle.
How to Trade Bullish Candles (Step-by-Step)
Trading isn’t just about spotting a green candle; it’s about managing risk. Here is a standard strategy for trading bullish signals:
1. Entry Point (The Buy Signal)
Don’t jump in as soon as you see green. Wait for confirmation.
Strategy: Place a “Buy Stop” order slightly above the high of the bullish candle. This ensures you only enter if the upward momentum continues.
2. Stop-Loss (Risk Management)
To protect your capital, you must know where you are wrong.
Placement: Place your stop-loss slightly below the low of the bullish candle or the recent swing low. If the price drops below this point, the bullish thesis is invalidated.
3. Price Target (Taking Profits)
Where should you exit?
Method: Look for the next major Resistance Level on the chart. A common approach is a Risk-to-Reward ratio of 1:2, meaning if you risk $100 on the stop-loss, your target should be at least $200 in profit.
Summary for Traders
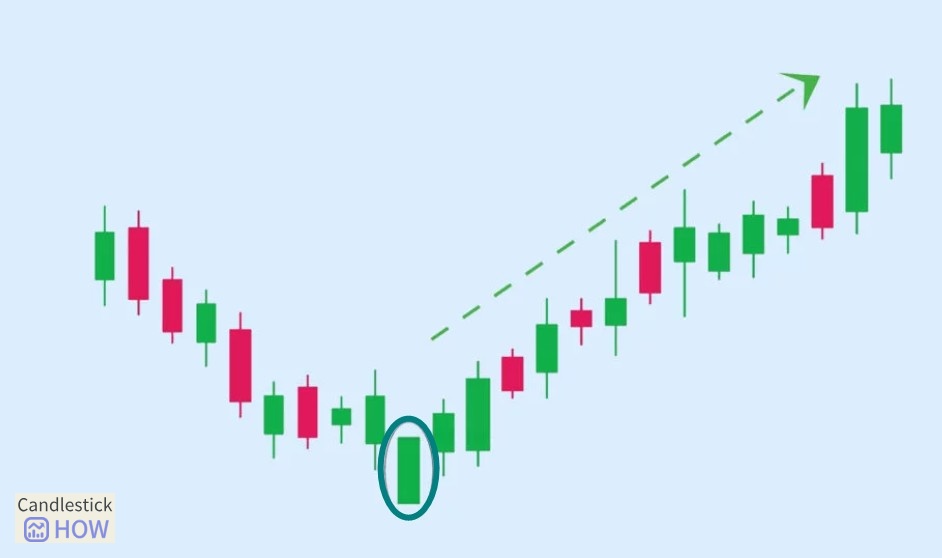
A Bullish Candle is more than just a green bar; it is a visual representation of market psychology. Large bullish candles after a period of consolidation often signal the start of a new bull run. However, always combine candlestick patterns with other indicators like Volume or RSI for better accuracy.